Data handling is an essential skill in mathematics and everyday life. Teaching this helps kids develop the ability to collect, organize, and interpret data, which is certainly crucial for making informed decisions.
Essentially, this way of processing data revolves around the collection and organization of information, making it significantly easier to comprehend. By utilizing numbers and graphs, we can effectively represent data and glean intriguing insights from it. Noteworthy real-life instances encompass online marketing surveys, the national census, the stock exchange, and voter polls.
This teaching guide provides a step-by-step approach to introducing and teaching data handling to kids of 6 to 11 years of age. It will also help you explore the exciting world of data handling, and understand different types of graphs with the help of captivating stories to make it even more fun!
Kids should have a basic understanding of numbers, counting, and basic math operations (addition and subtraction) before learning data handling.
Steps in data handling :
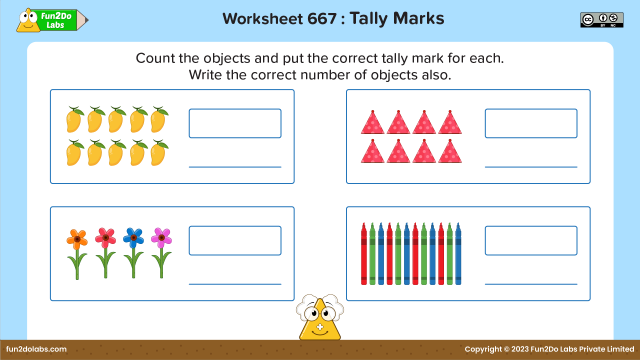
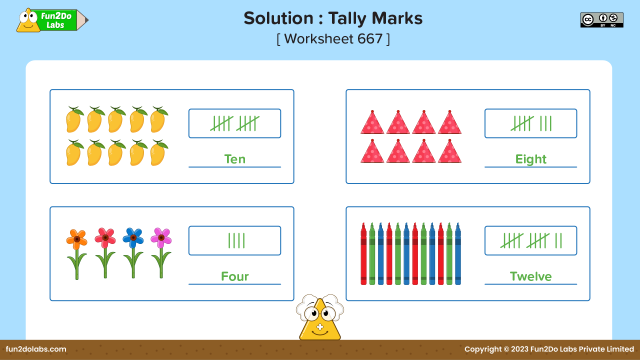
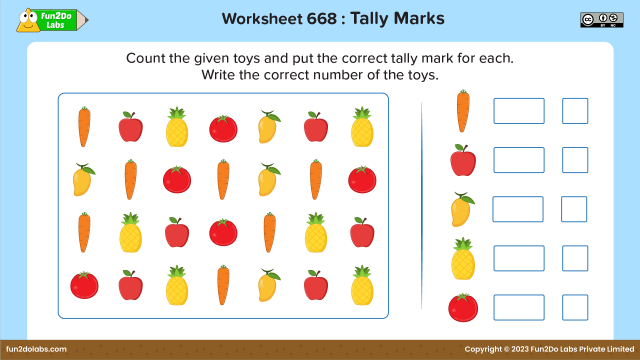
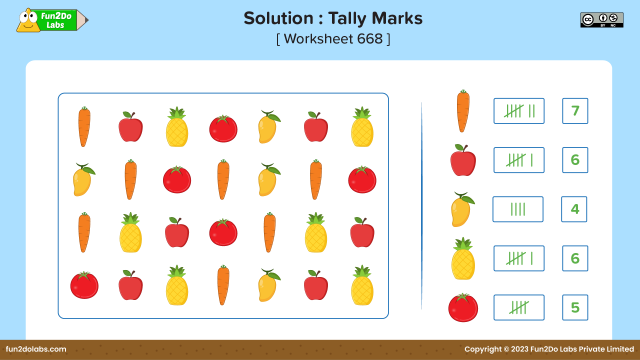
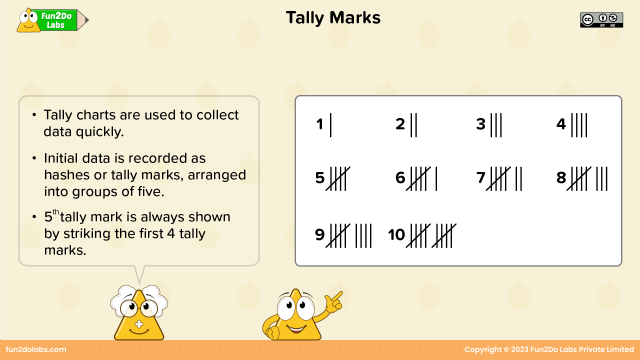
First of all, we collect data and present it in such a way that makes sense and is easy to understand. We can use simple data tables or tally marks to show the collected data. Certainly, the better way to represent the data visually is by using pictures or graphs! This way, we can quickly analyze the information, understand patterns, and it makes a big impact.
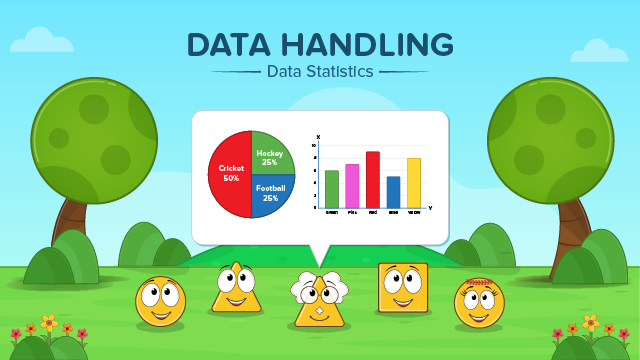
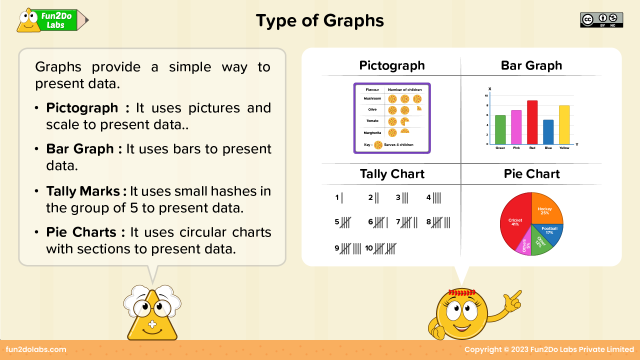
Types of graphical representation in data handling :
When it comes to data handling, we have some different ways to show information visually using graphs. We represent data can graphically by the following types :
- Pictograph
- Pie charts
- Bar graphs
- Line graph
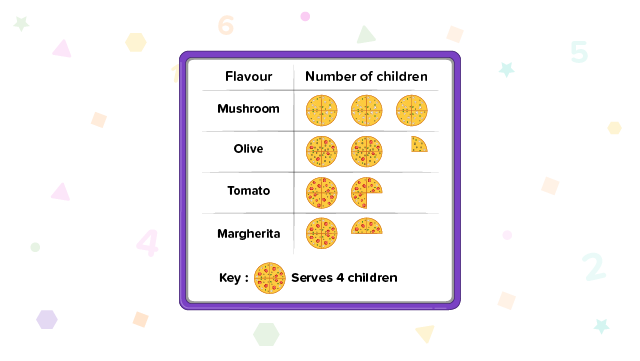
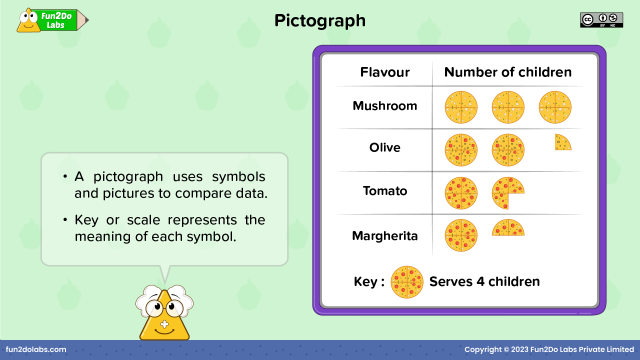
Pictograph :
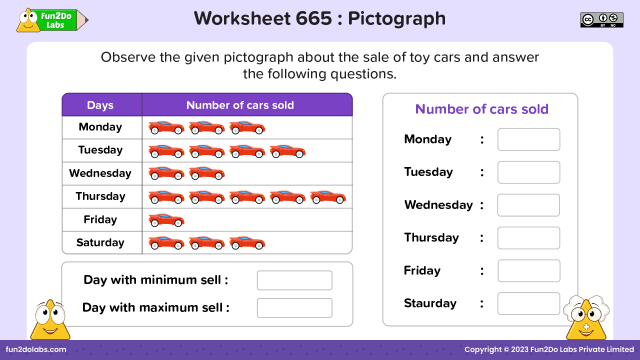
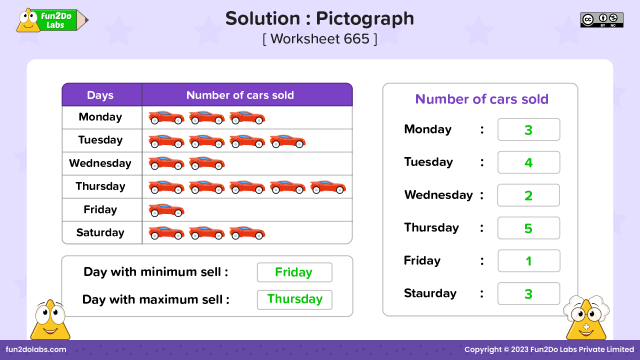
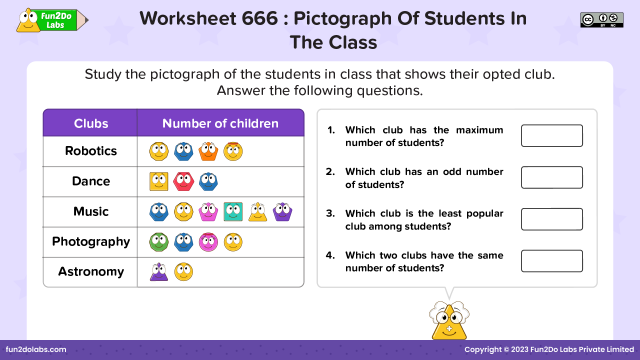
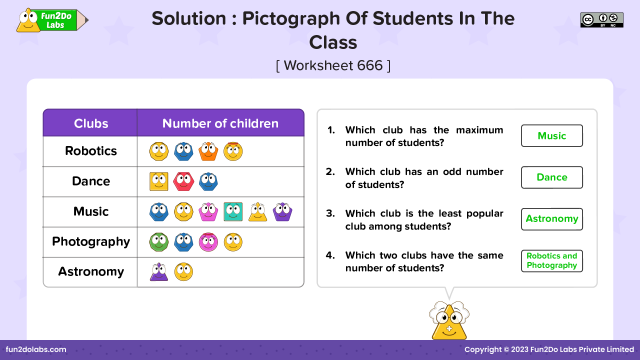
- We represent data using pictures, icons, or symbols by a type of graph called a pictograph. It’s the easiest way to show information in statistics and data handling. Pictographs make interpreting data super simple, especially when there is a lot of information to represent.
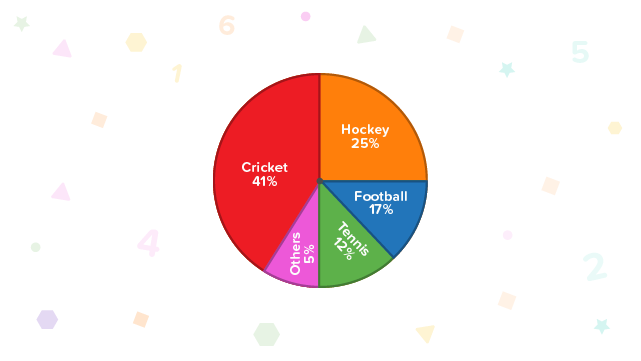
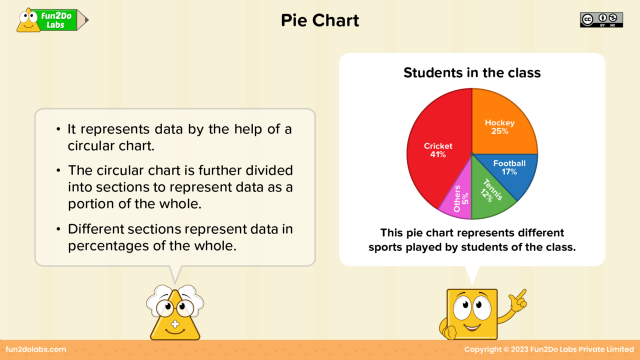
Pie Chart :
- Imagine representing data in a delicious circular graph called a pie chart. This chart has different sections, like slices of a pie, each representing specific information. Pie charts are great for showing things like business profits and losses or the number of something in school, in marketing and sales.
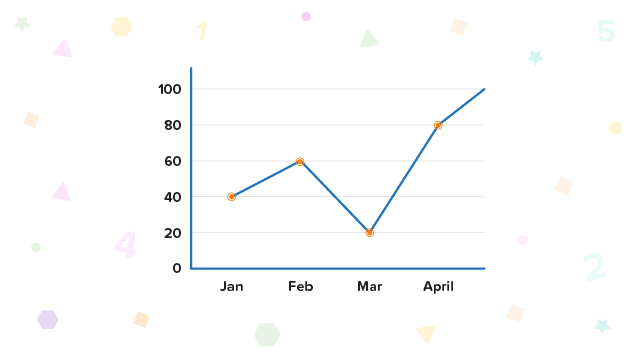
Line Graph :
- In data handling, we have a special type of graph called a line graph. It’s really helpful for showing how things change over time or in different situations. We make a line graph by connecting dots on the graph with lines. Each dot represents a specific data point.
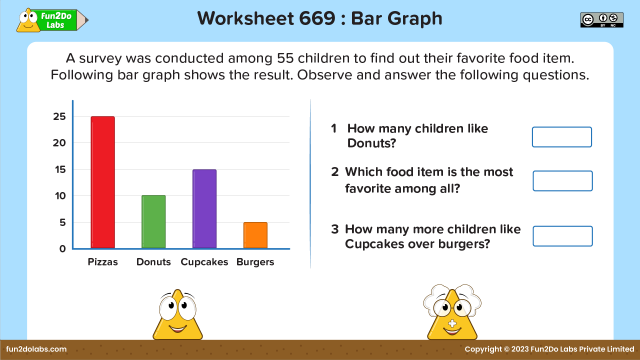
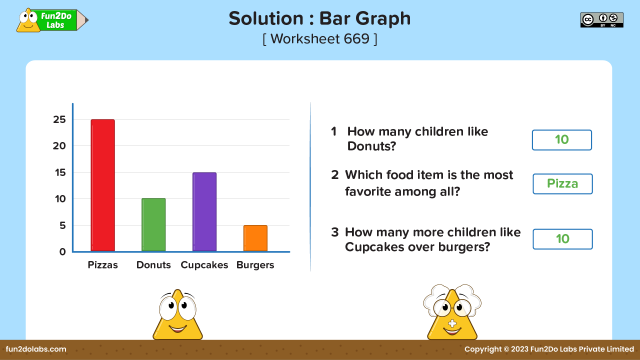
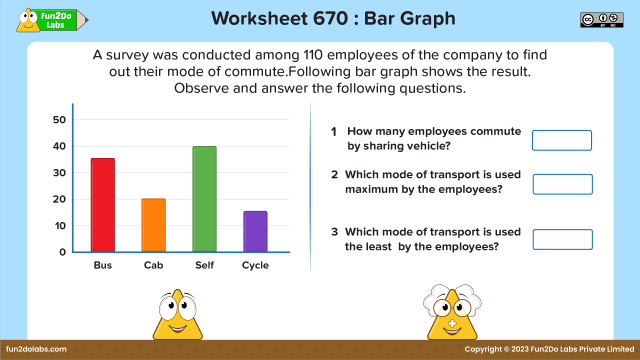
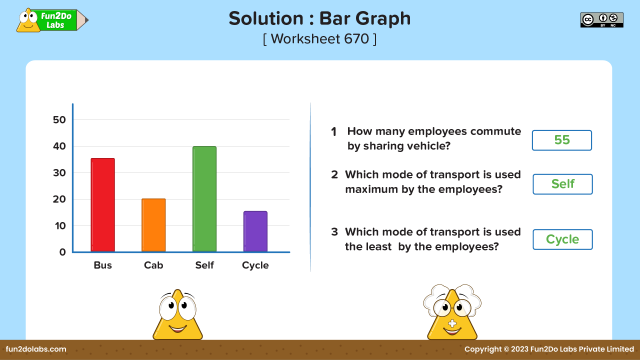
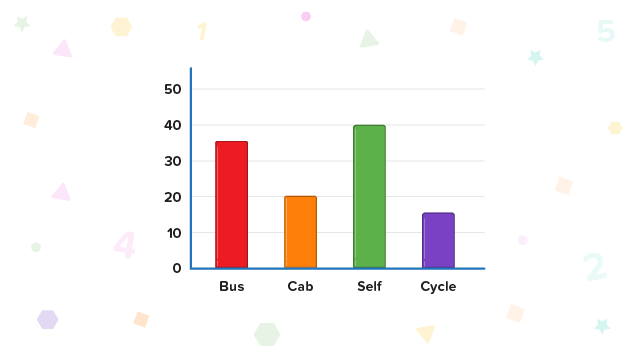
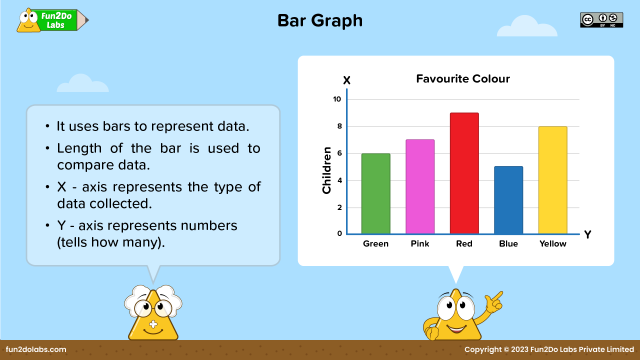
Bar Graph :
- We show data using vertical or horizontal bars by using bar graphs. These bars represent information, and their heights show how much each value is. Bar graphs are super useful for comparing data, and we commonly use them in statistics.


Teaching data handling with kid-friendly, clear, and easy-to-understand posters from Uncle Math School by Fun2Do Labs :
Ignite kids’ curiosity with engaging stories for role play and skits, making the learning of this concept an exciting and effective experience. Teaching data handling through stories from Uncle Math School by Fun2Do Labs :
- When The Century Is In Danger
- When The Kids Were Bored
- Mr Pictograph And Its Speciality
Learning data handling can be made enjoyable by incorporating interactive games and activities.
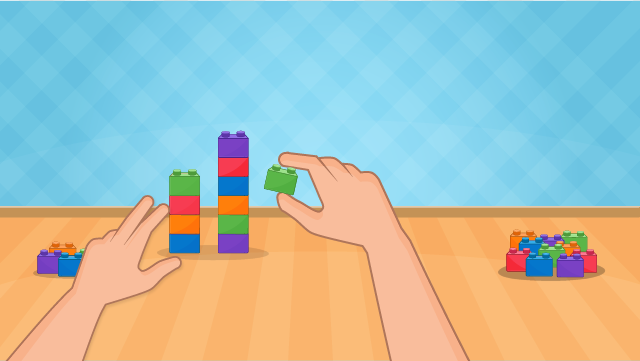
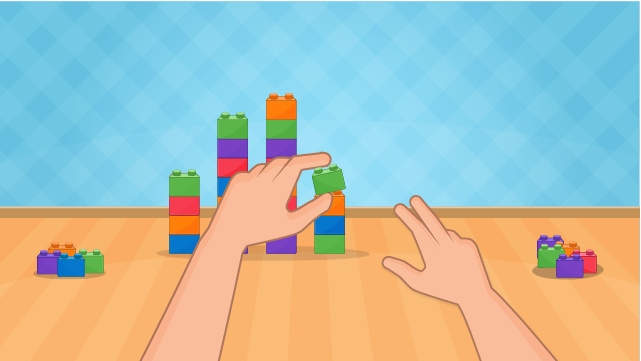
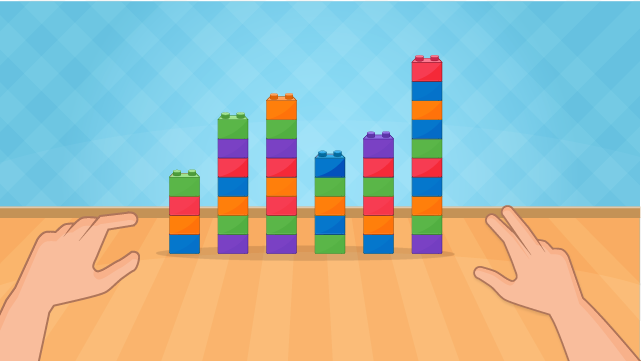
Bar Graph By Blocks :
Playing with blocks is loved by kids, and engaging them in this activity will undoubtedly foster a better understanding of bar graphs. Let’s carry out this activity in the following steps:
Firstly, collect data by asking the children about their favorite fruits.
Secondly, gather all the sheets and blocks required for the activity. Then, proceed to distribute them to the children.
Finally, instruct the children to draw a bar graph based on the collected data using the blocks.
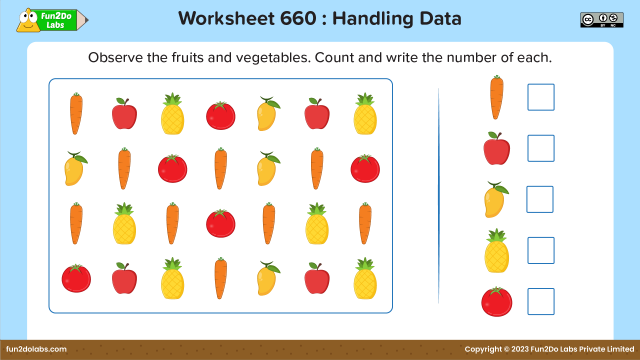
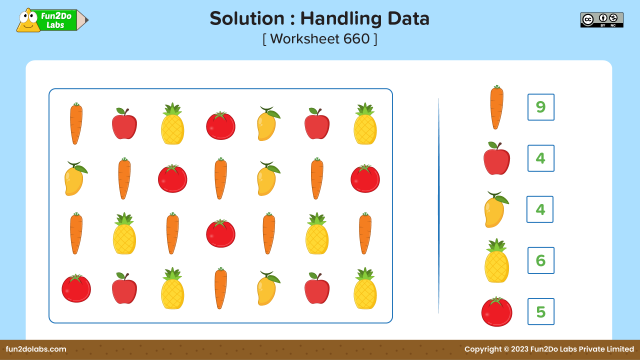
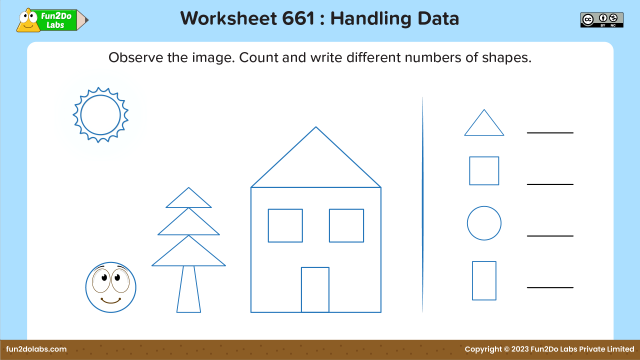
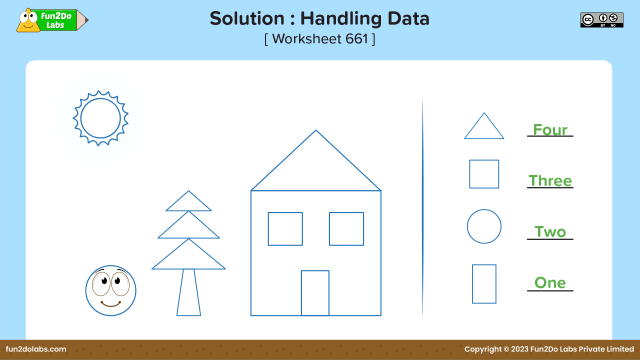
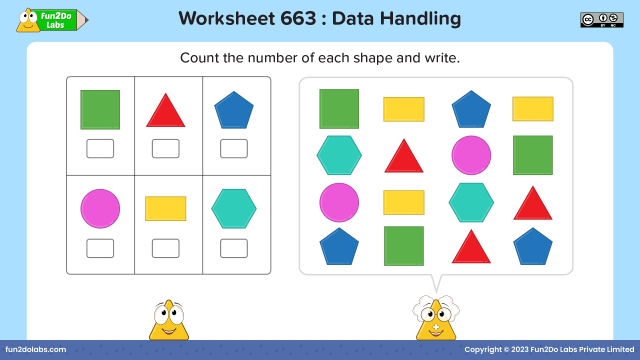
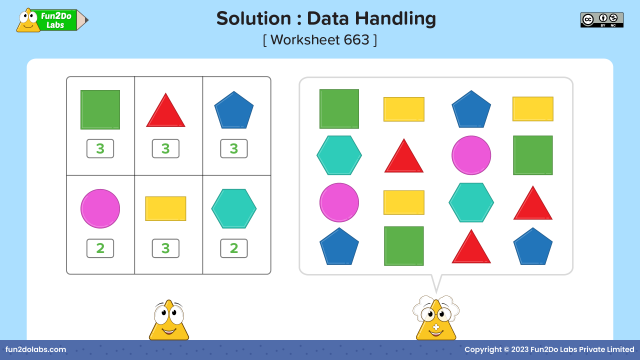
Help your kids practise data handling with interesting and engaging fun worksheets and solutions from Uncle Math by Fun2Do Labs.